A New Method for Urban Travel Rout Planning Based on Air Pollution Sensor Data
Homayoon Zahmatkesh1 * , Mohsen Saber1 and Majid Malekpour1
1
Department of Surveying and Geomatics,
University of Tehran,
Iran
http://dx.doi.org/10.12944/CWE.10.Special-Issue1.83
With the growth of urban transportation and the raise in the number of cars commuting in megacities, the need for a solution to travel healthy for daily activities becomes a place of importance. The air pollution issue could be regarded as one of the most important consequences of heavy traffic jam that affect citizens negatively. In this paper a new approach is presented in which concurrently decrease the harmful effect of air pollution on vulnerable people and also reduce the wasted time of people in traffic. In this research Dijkstra algorithm is used to find the optimum path which is efficient in both aspects of shortness and air quality condition. Three different weights are assigned for network dataset to evaluate the sensitivity of calculated path in various conditions.
Copy the following to cite this article:
Zahmatkesh H, Saber M, Malekpour M. A New Method for Urban Travel Rout Planning Based on Air Pollution Sensor Data. Special Issue of Curr World Environ 2015;10(Special Issue May 2015). DOI:http://dx.doi.org/10.12944/CWE.10.Special-Issue1.83
Copy the following to cite this URL:
Zahmatkesh H, Saber M, Malekpour M. A New Method for Urban Travel Rout Planning Based on Air Pollution Sensor Data. Special Issue of Curr World Environ 2015;10(Special Issue May 2015). Available from: http://www.cwejournal.org/?p=10115
Download article (pdf)
Citation Manager
Publish History
Introduction
The growth of technology and industrialization in last decades made the air pollution issue one of the most serious environmental challenges for megacities. Because of overpopulation of such urban areas, this problem could have devastating consequences on individuals’ daily life.6 The concentration of pollutants in Tehran, the capital of Iran, usually exceeds the international standards. This city could be considered as one of the most polluted cities of the world. The main reason of this pollution is the large amount of cars commuting through the transportation network of Tehran. Exposures to ambient concentrations for a long time has an irrecoverable impact on human health especially on vulnerable people such as children and adult who suffers from respiratory illnesses insofar as it may increase the mortality rate in this group of people.10 Because of unfavorable effects of unhealthy air condition on vulnerable people, public awareness is an effective solution to mitigate harmful impact of air pollution.5 By applying the information about air quality of the city, people could plan their routes for daily travels. In this paper, a solution is proposed to provide the best route for citizens by considering their priorities. It is possible to calculate optimum path based on the user defined constraints and weights. In this research, the observations of Tehran’s air pollution measurement stations is combined with distance parameter by determining different weights.
Related Works
Path finding problem could be regarded as a controversial issue in various GIS applications from marine GIS to urban traffic management. G.Mannarini and G.Coppini in 2013 presented a decision support system in marine environment by considering the safety restrictions of the vessel navigation through the rough weather. In this system the weather routing is obtained using a modified Dijkstra algorithm on the graph consisting of meteoâ€oceanographic fields.1
In 2011 Wu Jigang et al. calculated a shortest safe path between two special nodes in a time dependent transportation network utilizing in many applications such as heavy truck carrying inflammable materials and poison gas. The algorithm proposed in this paper could find optimal solution and the best starting time on the both undirected and directed time dependent networks.3
In 2008 S.Panahi and M.R.Delavar developed a spatial decision support system for emergency vehicles routing based on integrating GIS and real-time traffic conditions. In this model the shortest path is based on Dijkstra algorithm with intelligently updating the determined path in the duration of driving.2
Air Quality Index
A useful parameter for controlling air pollution is determining concentration of pollutants and describing air quality based on international standards. So, in this research Air Quality Index is used as the standard. Based on this standard the level of pollution could be available for public and it could be possible to take effective measure in critical conditions in which air quality level is undesirable. AQI is an index for reporting air quality and its impact on different group of people. This index has 6 different interval with different color that each of them displays the level of danger on health.4
In this research, people are classified in different level of health using proposed algorithm and the suggested path is computed and offered them.
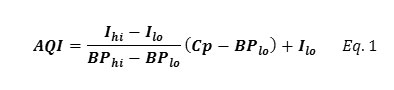
As shown in Table 1 the concentration of pollutants and AQI values could be classified in several classes. The AQI value is computed using Eq.1. In this equation Cp is concentration of pollutant and is the break point which is greater or equal to Cp and is the break point that is less or equal to the Cp and both of them are comes from table 2. The Ihi and I10 are the AQI values corresponding to the BPhi and BPlo. So, by replacing the value of BPhi and BPlo for every pollutant and Ihi and Ilo for every AQI interval from table 1. The AQI value is computed.
Table 1: Breakpoints for the AQI
| O3 | PM10 | CO | SO2 | AQI |
| 0.000-0.064 | 0 – 54 | 0.0-4.4 | 0.000-0.034 | 0-50 |
| 0.065-0.084 | 55 – 154 | 4.5-9.4 | 0.035-0.144 | 51-100 |
| 0.085-0.104 | 155 – 254 | 9.5-12.4 | 0.145-0.224 | 101-150 |
| 0.105-0.12 | 255 – 354 | 12.5-15.4 | 0.225-0.304 | 151-200 |
| 0.125-0.374 | 355 – 424 | 15.5-30.4 | 0.305-0.604 | 201-300 |
| 425 – 504 | 30.5-40.4 | 0.605-0.804 | 301-400 | |
| 505 – 604 | 40.5-50.4 | 0.805-1.004 | 401-500 |
Generally the reported AQI in a region enables people to determine air quality, its impact on health and level of danger of air pollution. In addition managers and authorities use this index to report the quality of the air and take effective measures in critical conditions to control the level of pollution efficiently. The AQI classifies citizens in 6 different groups based on their health level to provide sensible representation of the effect of the air pollution on health as shown in table 2. As displayed in this classification, every color has a specific meaning.5
Table 2: AQI colors and its impact on different group of people
| AQI | Meaning | ||
| Good | 0-50 | Air quality is considered
satisfactory, and air pollution poses little or no risk |
|
| Moderate | 51-100 | Air quality is acceptable | |
| Unhealthy for sensitive group | 101-150 | Members of sensitive groups may experience health effects. The general public is not likely to be affected. | |
| Unhealthy | 151-200 | Everyone may begin to experience health effects | |
| Very Unhealthy | 201-300 | Health warnings of emergency conditions. The entire population is more likely to be affected | |
| Hazardous | 301-500 | Health alert: everyone may experience more serious health effects | |
Shortest Path Method
Dijkstra shortest path method, is a common graph based route finding algorithm that released by Edgar Dijkstra in 1959 [1]. This method find the shortest path and in other word the path with minimum cost in the graph if there was no edge with negative cost. Dijkstra algorithm is a single source algorithm which determine the shortest path between a special node and the other nodes in graph. Therefore the shortest path between two special nodes would be calculated with implementation of a stop condition. The algorithm starts from an interested node names Start Node and the distance between the other nodes and this node is calculated names Distance. This Distances updates gradually. The steps of algorithms is detailed in the following2:
Initially the Distances is set to zero for the Start Node and to infinity for the other nodes.
A State is assigned to each nodes of graph. This state could be Visited, Unvisited and Current. For Start Node State is set to Current and for other nodes to Unvisited. Then a Queue of Unvisited node is created.
For node with Current State, all the neighbor nodes with Unvisited State must be checked and the Distance has to be calculated. If this new Distance is less than the old one it would be replaced. In this step the State of neighbors remains to Unvisited.
After examination of all neighbor nodes of the Current node, the State of this node changes to Visited and will be deleted. Note that the node with Visited State never be checked again.
If the State of end node of graph changes to Visited, the algorithm will stop. In case of remaining nodes with infinity Distances in Queue there is no path between start and end nodes of graph and this two nodes are not connected.
The node with minimum Distance from the Queue is selected and its State Changes to Current. Next the algorithm repeat from step c.
Route Finding Based on Air Quality Index
The overall idea of optimum route finding under the condition of air pollution is based on the Dijkstra algorithm. The final optimum path could be calculated based on the user defined costs and parameters. The costs and constraints of path finding algorithm is determined by defining network dataset and specifying related parameters for weights. In this paper, different paths are calculated as optimum path by considering various constraints for network dataset. The final paths are provided based on the several parameters such as distance, air quality index or combination of both of them to distinguish the influence of each of them on the proposed path. As shown in Fig. 1, to calculate the interested path, the entire workflow of processes consists of a sequence of geospatial processes in which the interpolated map of air quality index plays an important role to give an optimum healthy path.
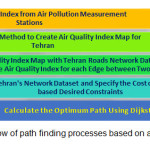 |
Figure 1: The workflow of path finding processes based on air quality index Click here to View figure |
Because of the importance of air pollution and necessity of finding appropriate route for vulnerable people, in this research the capital city of Iran, Tehran, considered as our case study. Data gathered by the air pollution measurement stations are applied to create air quality index map for Tehran. As shown in Fig. 2, nineteen stationary sensors are located in Tehran to observe different kinds of air pollution parameters. These sensors gather the amount of pollutants in each station. In the following map, the amount of Carbon Monoxide (CO) parameter at the station of Pirouzi Street is depicted. To calculate the optimum path the air quality index of CO parameter is used.
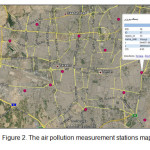 |
Figure 2: The air pollution measurement stations map Click here to View figure |
Based on the air quality index classes, the map of Tehran is depicted in six classes in Fig. 3, in which each region shows the amount of healthiness of Tehran air condition in one sample moment of measurement.
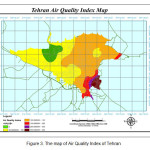 |
Figure 3: The map of Air Quality Index of Tehran Click here to View figure |
The cost of each edge could be achieved from overlay of air quality index map with Tehran’s network data set layer. By considering different constraints and costs for network dataset layer, it is possible to calculate several paths based on various travel cost. Three different network dataset layers are specified by defining three travel costs in order to compare proposed paths. The first optimization parameter is distance parameter. The air quality index is considered a travel cost in second layer. Finally a weighted combination of both parameters is considered as third travel cost parameter to optimize both parameters. In third layer the weight of air quality index is two times greater than the weight of distance parameter.
The creation and calculations of each network dataset layer is done by applying Network Analysis toolbox of ArcGIS software. Three constant points is defined in the network in order to calculate, display and compare proposed paths in different constraints. The origin point for desired path is located on the cross of Shahid Rajaei and Azadegan’s Highways. The second constant point is considered somewhere on the Shahid Mahallati’s Highway. Finally the path is expected to be finished on the cross of Fatemi and Jamalzade’s streets. As shown in Fig. 4, different paths could be calculated for each data layer by considering different costs for network edges. The path in blue color is calculated based on minimizing the whole distance of traveling between specified points. By minimizing the AQI value the second path could be achieved which is shown in black color on the map. The second path could suggest us the healthiest and the longest path to meetthe stop points. Thus the distance parameter doesn’t have any influence on the final optimized path. the last path is calculated to minimize a weighted combination of two parameters. In this solution, after normalizing the distance and AQI parameters, a value of 0.33 is assigned as the weight of distance parameter and a value of 0.67 is assigned as the weight of AQI parameter. This path could give the shortest path in least unhealthy conditions for vulnerable people by considering the predefined weights. As depicted in Fig. 4, the suggested path in color green avoids passing from high risky regions in red color on the map and prefers to travel through yellowish regions with healthier conditions.
Because of three different predefined criteria, various lengths are calculated for these paths. The length of optimum path based on distance parameter, based on AQI value and based on combination of both parameters are equal to 18.05, 24.25 and 19.60 kilometers, respectively. As stated above, the path considering only the AQI parameter provides the longest path and the weighted path of both parameters regards for both of healthiness and distance. Each of proposed paths could be an appropriate solution for different citizens based on the user’s goal of path finding and the level of him/her vulnerability. Also it is possible to change the amount of specified weights for each parameter to achieve desired path based on specific objective.
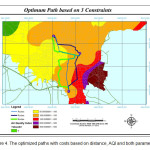 |
Figure 4: The optimized paths with costs based on distance, AQI and both parameters Click here to View figure |
Conclusion and Remarks
In this research by considering route planning concepts and algorithms, the importance of route planning in polluted environment specifically in megacities were highlighted. So, by considering air pollution as an important issue in urban management, route planning based on AQI in Tehran as a case study was conducted. Three different possible plans were offered to provide appropriate path based on interested constraints. The first plan only consider the distance and minimize the length of the whole path without regarding any other parameter. While, the other ones consider the air quality index as a factor in the route planning process. The final paths show the sensitivity of desired path to specified values. As a result rather than considering the people’s health and mitigating the devastating impact on their health, urban managers can decrease the amount of traffic by taking people away from hot spots of traffic and also decrease the air pollution.
References
- Skiena, S. Dijkstra's Algorithm. Implementing Discrete Mathematics: Combinatorics and Graph Theory with Mathematica, Reading, MA: Addison-Wesley, 225-227, (1990).
- Leiserson, Charles E, Rivest, Ronald L, Stein, Clifford, & Cormen, Thomas H. Introduction to algorithms: MIT press, (2001).
- Dijkstra, Edsger W. "A note on two problems in connexion with graphs." Numerische mathematik 1.1, p:269-271, (1959).
- Stasch, C., et al., A stimulus-centric algebraic approach to sensors and observations, in GeoSensor Networks, Springer. p. 169-179, (2009).
- Samadzadegan, F., H. Zahmatkesh, and M. Saber. "An Interoperable Architecture for Air Pollution Early Warning System Based on Sensor Web." ISPRS-International Archives of the Photogrammetry, Remote Sensing and Spatial Information Sciences 1.3, p: 459-462, (2013)
- Alesheikh, A., Oskouei, A., Atabi, F., Helali, H., providing interoperability for air quality in-situ sensors observations using GML technology, (2005).
- Service, G. Mannarini & G. Coppini, P. Oddo, N. Pinardi, “A Prototype of Ship Routing Decision Support System for an Operational Oceanographic”, TransNav the International Journal on Marine Navigation and Safety of Sea Transportation, (2013)
- Panahi, S., Delavar, M.R., A GIS-based Dynamic Shortest Path Determination in Emergency Vehicles, World Applied Sciences Journal 3 (Supple 1): 88-94, (2008).
- Jigan, Wu., Jin, S., Ji, H., Srikanthan, T., Algorith, for time-dependent shortest safe path on transportation networks, Procedia Computer Science 4, 958-966, (2011).
- Dockery, D. W., Pope, C. A., Xu, X., Spengler, J. D., Ware, J. H., Fay, M. E.,... & Speizer, F. E., An association between air pollution and mortality in six US cities. New England journal of medicine, 329(24), 1753-1759, (1993)


